


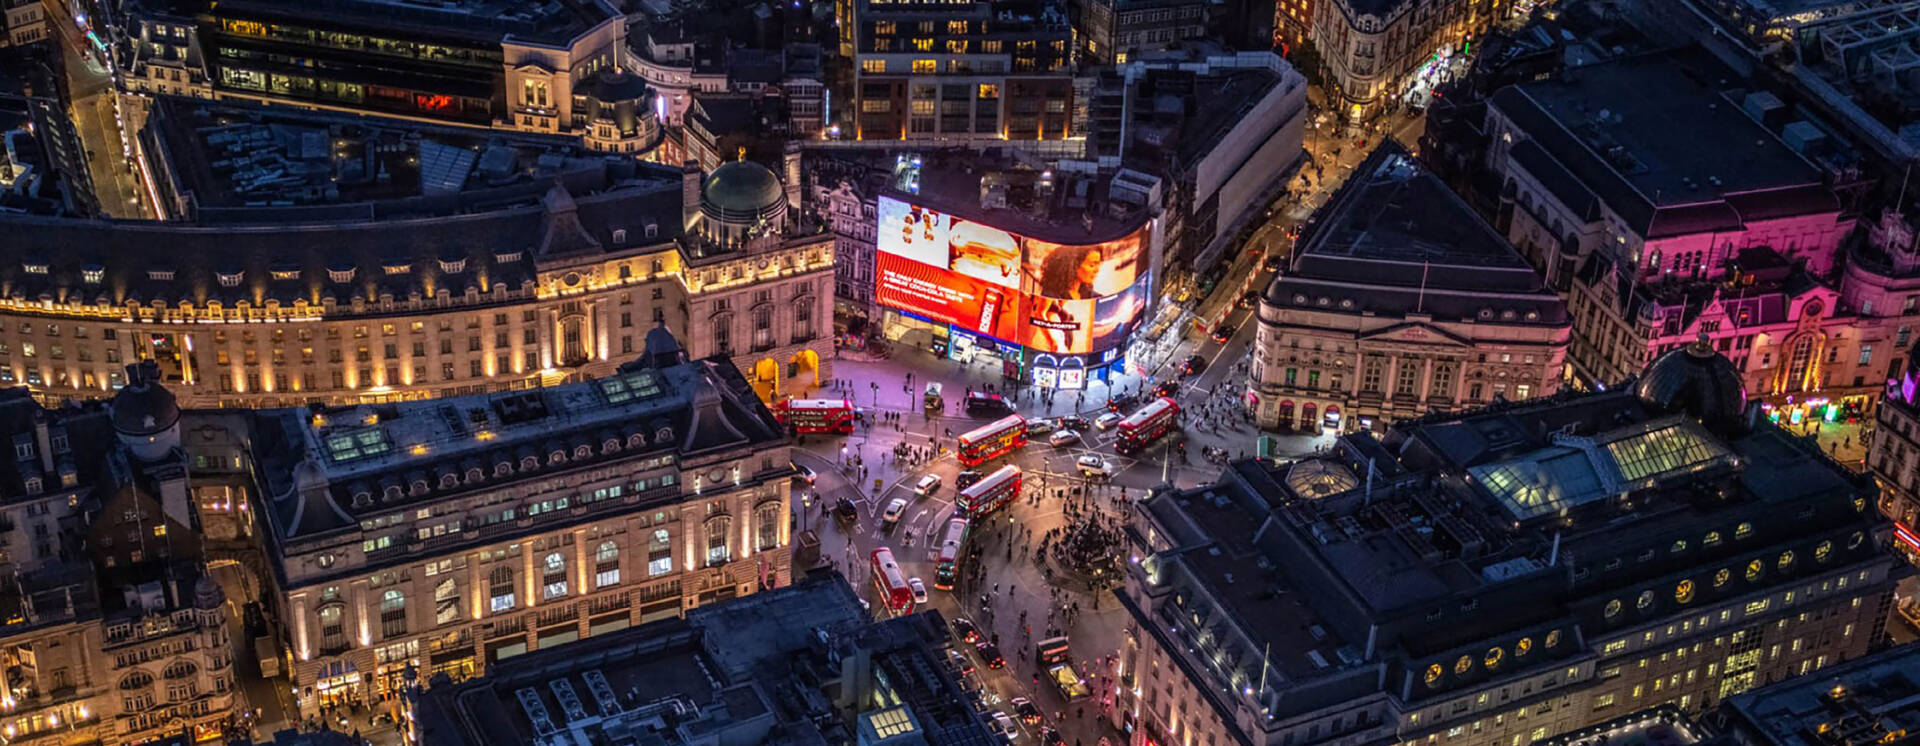
Footfall figures in the West End show an increase of 11.9% in 2022/23
In our first annual report since the pandemic, we present an in-depth look at the changing visitor trends in the West End over a 12-month period.
The report provides a more granular look at the demographics of visitors in the area, both domestic and international, including age profiling, visitor behaviour, occupations, gender split and dwell time, as well as hotel occupancy figures and footfall figures.
Key takeaways:
- Results show footfall has increased by 11.9% in 2022/23, with all districts experiencing growth in comparison to 2021/22 period for the HOLBA area.
- International footfall has increased by 26% since 2021/22, largely driven by the USA and Europe. Results show that long-haul visitors such as from South America, the Middle East and Southeast Asia began to increase toward the end of 2022 into 2023.
- Hotel occupancy is now at 72% and projections forecast a return to pre-pandemic levels in Q4 of 2024.
- Footfall peaked in September of 2022, compared to the previous year, coinciding with the end of summer holidays and the return of commuters, alongside the funeral of Queen Elizabeth II.
- International footfall has increased and now accounts for almost 22% of total footfall across the HOLBA area, up from 19.5% since the 2021/22 period. When comparing all districts, Piccadilly Circus has the highest percentage (28.5%) followed by Haymarket (14%).
- Comparing weekdays, hybrid working has resulted in a decline in footfall on Mondays and Fridays with data displaying an increase in footfall mid-week in comparison to 2019.
- Data shows there has been little change in demographics and remains broadly consistent with 2019.
For further information, email Matt Harris, Data and Insights Manager at matth@holba.london.
Sign up
Members can receive exclusive weekly, monthly and annual reports on trends that impact the performance of our area.